Low Rank Enhanced Matrix Recovery of Hybrid Time and Frequency Data in Fast Magnetic Resonance Spectroscopy (中文,English)
Hengfa Lu1, Xinlin Zhang1, Tianyu Qiu1, Jian Yang1, Jiaxi Ying1, Di Guo2, Zhong Chen1, Xiaobo Qu1,#
1 Department of Electronic Science, Fujian Provincial Key Laboratory of Plasma and Magnetic Resonance, Xiamen University, Xiamen, China
2 School of Computer and Information Engineering, Xiamen University of Technology, Xiamen, China
# Emails: quxiaobo <at> xmu.edu.cn or quxiaobo2009 <at> gmail.com
Citations: Hengfa Lu, Xinlin Zhang, Tianyu Qiu, Jian Yang, Jiaxi Ying, Di Guo, Zhong Chen, Xiaobo Qu, Low rank enhanced matrix recovery of hybrid time and frequency data in fast magnetic resonance spectroscopy, IEEE Transactions on Biomedical Engineering, 65(4): 809-820, 2018.
Synopsis:
Magnetic resonance spectroscopy (MRS) serves as a indispensable tool for protein structure analysis and material composition analysis in biomedical engineering. Multidimensional MRS resolves spectral peak overlap and provides new information about the relationship between atomic nuclei, which is of great significance for the analysis of complex biological macromolecules. However, limited by physical mechanisms such as evolution time of indirect dimension, the data acquisition time of typical multidimensional spectrum increases sharply with the rise of dimensionality and resolution. Therefore, accelerating the acquisition process of multidimensional MRS is of great importance.
Having been one of typical approaches for speeding up data acquisition, the spatio-temporally encoded technology seeks to optimize experimental pulse sequences. Fast data acquisition is achieved by coding the frequency information in direct dimension concurrently, but the technique requires strong data acquisition gradient that may causes damages to the instrument. To alleviate the demand of strong pulse gradient, the non-uniform sampling is introduced into the spatio-temporally encoded MRS. However, this operation results in data points missing in the hybrid time and frequency plane.
From the perspective of signal processing, how to perform high-quality reconstruction of the hybrid time and frequency signal possesses as a challenging problem. The most cutting-edge method is to recover the spatio-temporally encoded data by enforcing the sparsity of the spectrum. However, this approach may cause distortion and even loss of spectral peaks. Therefore, it is urgent to build new signal reconstruction methods.
Starting from the low-rank characteristics of time-domain MRS signals, we exploit how to model hybrid time and frequency signal into exponential functions to recover missing data points. We propose a hybrid time and frequency signal reconstruction approach based on low-rank block Hankel matrix, and deduce its fast numerical algorithm. Experimental results show that spectral peaks reconstructed by the proposed method is more consistent to the fully sampled spectral peaks than that by spectrum sparse based method, and achieves more accurately quantification of the proton resonance volume in the material enjoying more than 5 times quantification accuracy. Proposed methods may be extended to other MRS reconstruction problem such as MRS denoising and the reconstruction of other 2D exponential signals. Proposed methods can be further explored in algorithm convergence and large-scale low-rank reconstruction algorithms.
Method:
1. Background
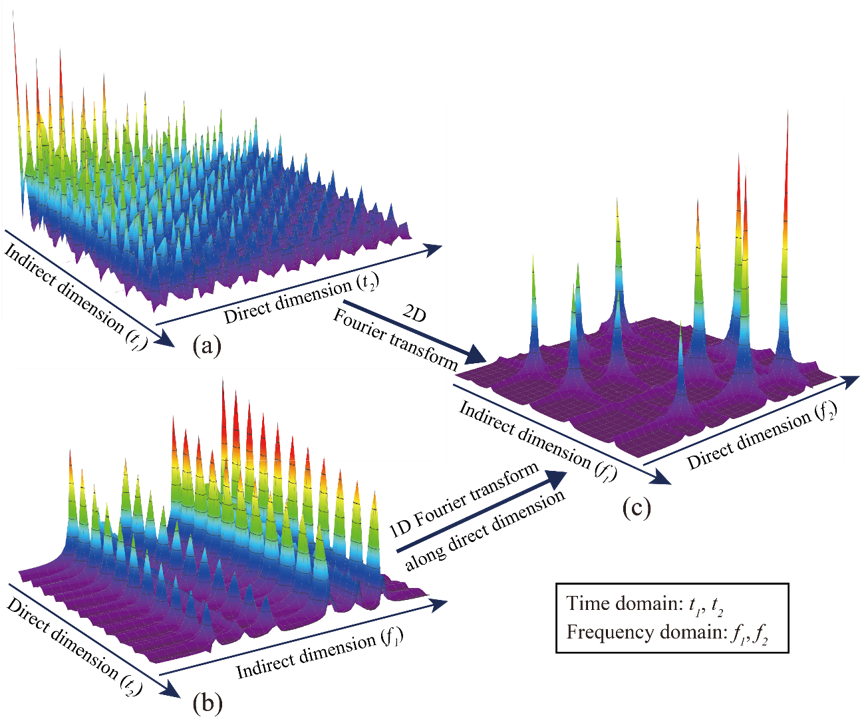
Non-uniformly sampling has been introduced in spatiotemporally encoded ultrafast (STEU) MRS, which saves significant time of successive 1D experiments in the conventional 2D MRS, to alleviate its demanding of strong acquisition gradient. The specific encoding scheme in STEU MRS results in its indirect dimension lying in the frequency domain, but not in the time domain as conventional MRS does. Therefore, only 1D Fourier transform is performed on the direct dimension to obtain a complete 2D spectrum. The 2D STEU MRS data are acquired in a hybrid time and frequency (HTF) plane (Fig. 1(b)). However, the utilization of non-uniformly sampling leads to the missing of data points on the HTF plane (Fig. 2). Then, we have to reconstruct these missing points with proper spectrum properties to obtain a high resolution MRS.
Fig. 1. An illustration of acquired 2D MRS signals using traditional and STEU methods. (a) The traditionally acquired signal in the time-time plane; (b) The STEU acquired signal in the time-frequency plane; (c) The 2D spectrum in the frequency-frequency plane.
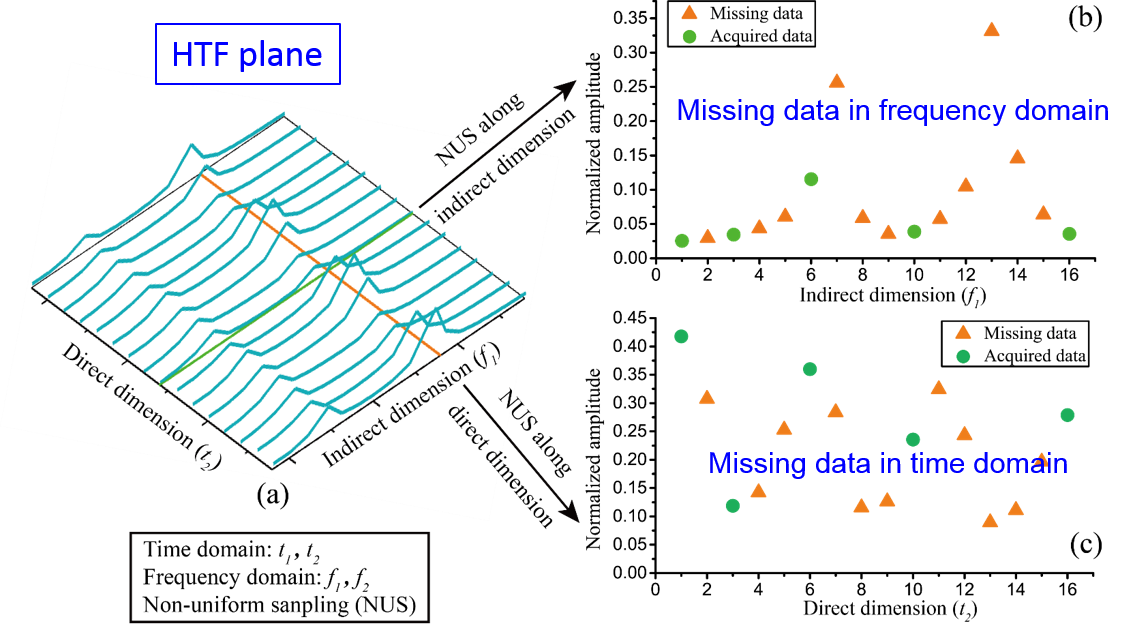
Fig. 2. Principle illustration of hybrid time-frequency plane.
2. Low-rank block hankel matrix reconstruction of non-uniformling HTF signal (LRBHM-HTF)
The 2D MRS signal can be modeled as a sum of damped exponentials, and it has been shown that the block Hankel matrix constructed using time domain MRS signal is low rank implying that the low rank property can be applied in MRS reconstruction. We proposed to restore HTF signal by exploring the low rankness of 2D MRS
$$ \min_\mathbf{G} \left \| \mathbf{BF}_\textit{freq}^{-1}\mathbf{G} \right \|_*+\frac{\lambda }{2}\left \| \mathbf{Y-P}_\Omega \mathbf{G} \right \|_F^2, $$ where $\mathbf{G}$ denotes the 2D HTF signal to be reconstructed, $\mathbf{Y}$ acquired HTF data with zeros filling on non-acquired data points, $ \mathbf{P}_\Omega$ the operator that performs undersampling on 2D signal with zeros filling on non-acquired data points and $\left \| \cdot \right \|_F$ the Frobenius norm (the square root of the sum of the squares) of a matrix. The parameter $\lambda$ tradeoffs between the nuclear norm term $\left \| \mathbf{BF}_\textit{freq}^{-1}\mathbf{G} \right \|_*$ and data consistency term $\left \| \mathbf{Y-P}_\Omega \mathbf{G} \right \|_F^2$. Fundamentally, we are looking for a 2D spectrum with minimal number of peaks subject to the acquired data.
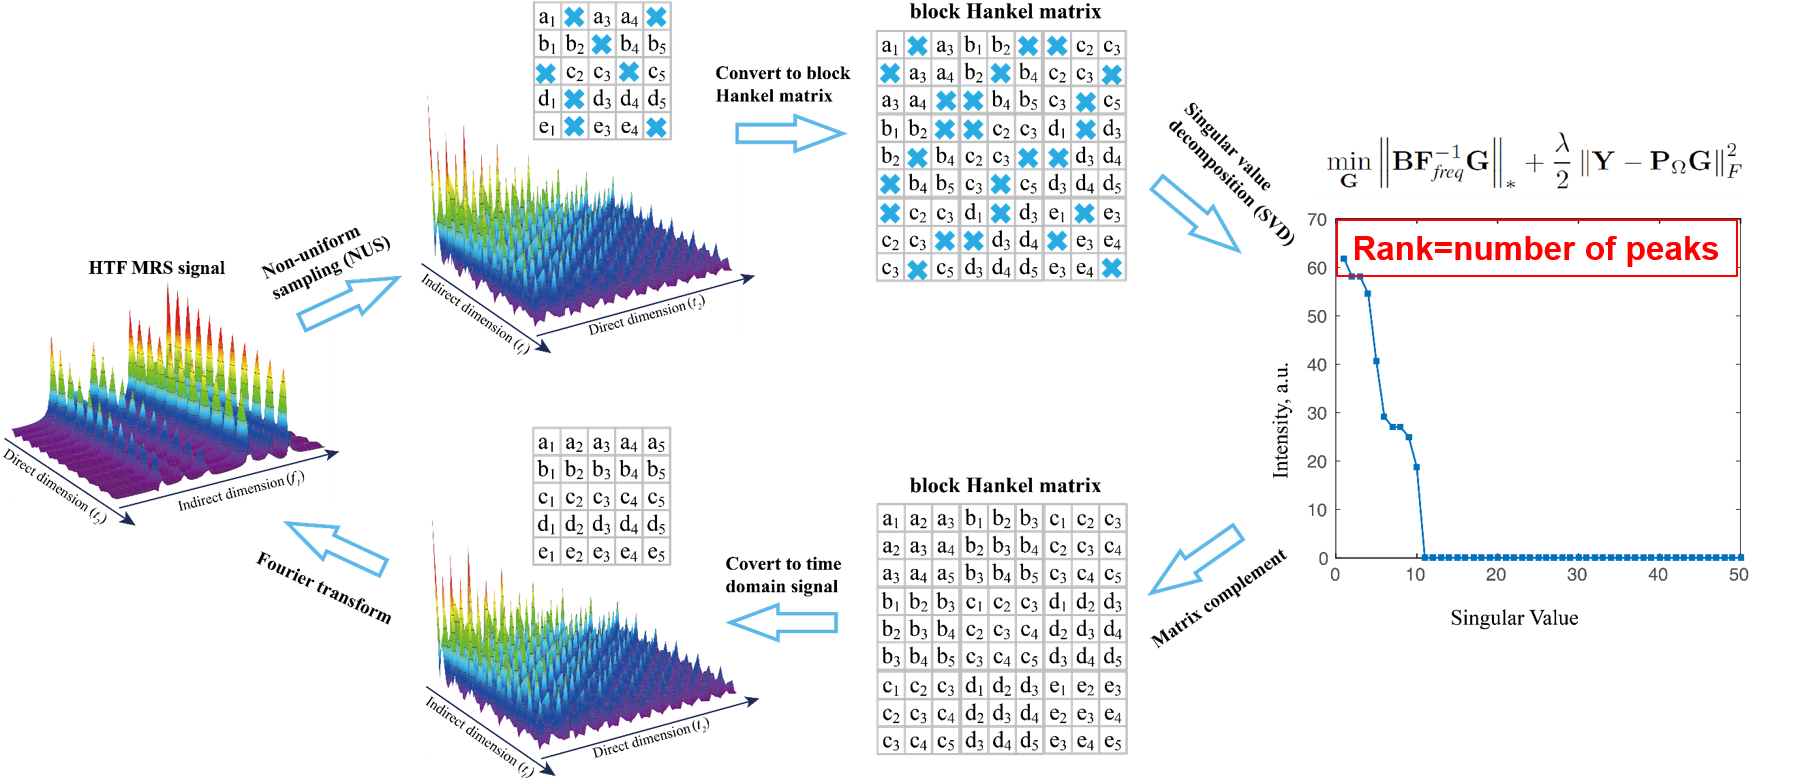
Fig. 3. Low rank Hankel matrix-based NMR spectrascopy reconstruction.
3. Main result
A 2D STEU correlation spectroscopy (COSY) of a special oil is used to validate the proposed method. This kind of oil exists in intrahepatic fat of liver, and measuring it through MRS serves as an important tool for clinical trials and observational studies. Fig. 4 shows the reconstructed STEU spectrum. Eight low intensity peaks are weaken or missed in CS reconstruction (see arrows in Fig. 4(b)). In contrast, these low-intensity peaks are reconstructed much better using the proposed method meanwhile other peaks are still reconstructed very well. The values of Pearsons linear correlation coefficient R2 of CS and the proposed method are close to 1 when all peak intensities are included in regression statistics (Fig. 5(a) and (b)), which implies that both CS and the proposed method provide nice reconstructions. However, when focusing on low-intensity peaks (at a range of 0 to 0.25), we observe that the values of R2 of CS method drops to 0.9966, but the value of R2 of proposed method remains 0.9998 (Fig. 5(c) and (d)). The R2 value implies that the proposed method produces more consistent reconstruction for low-intensity peaks (Fig. 4(c)) than CS (Fig. 4(b)).
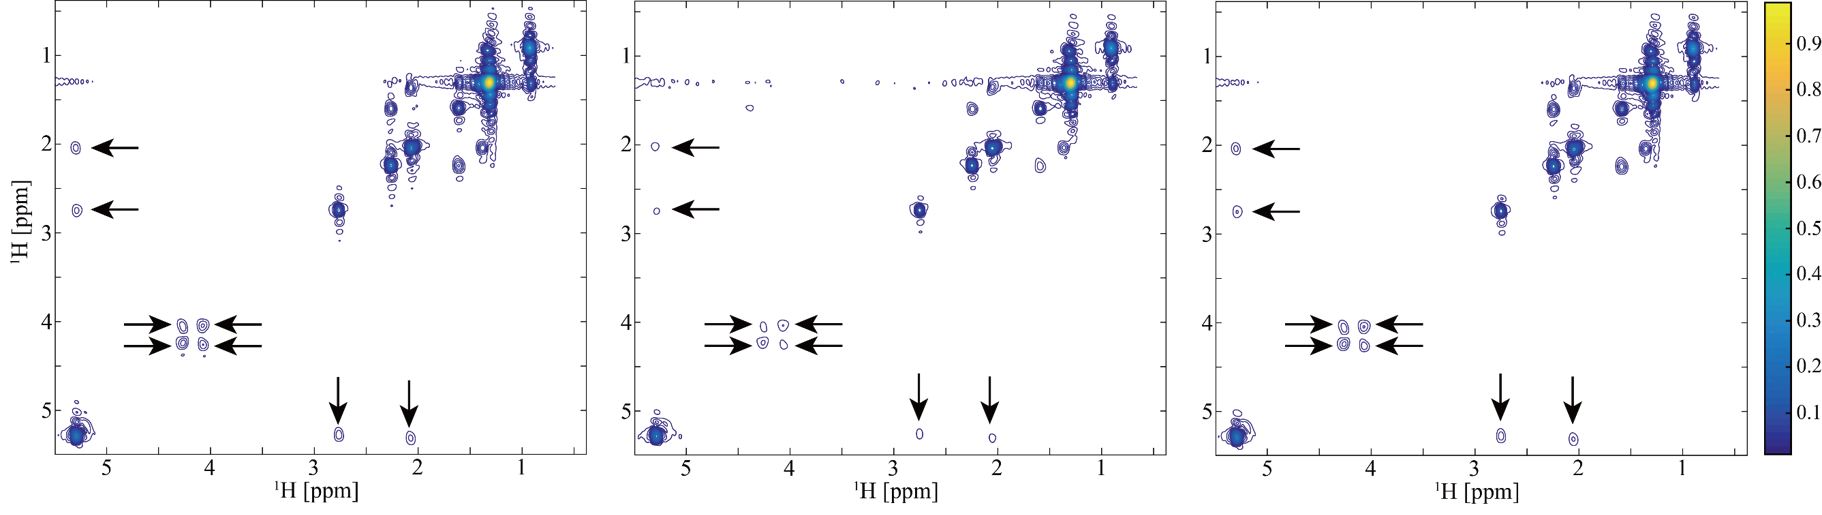
Fig.4 Reconstruction of STEU COSY spectrum. (a) The full sampled STEU COSY spectrum; (b) The reconstructed spectrum by CS; (c) The reconstructed spectrum by proposed method. Note: All spectra are plotted in a contour level of 90.
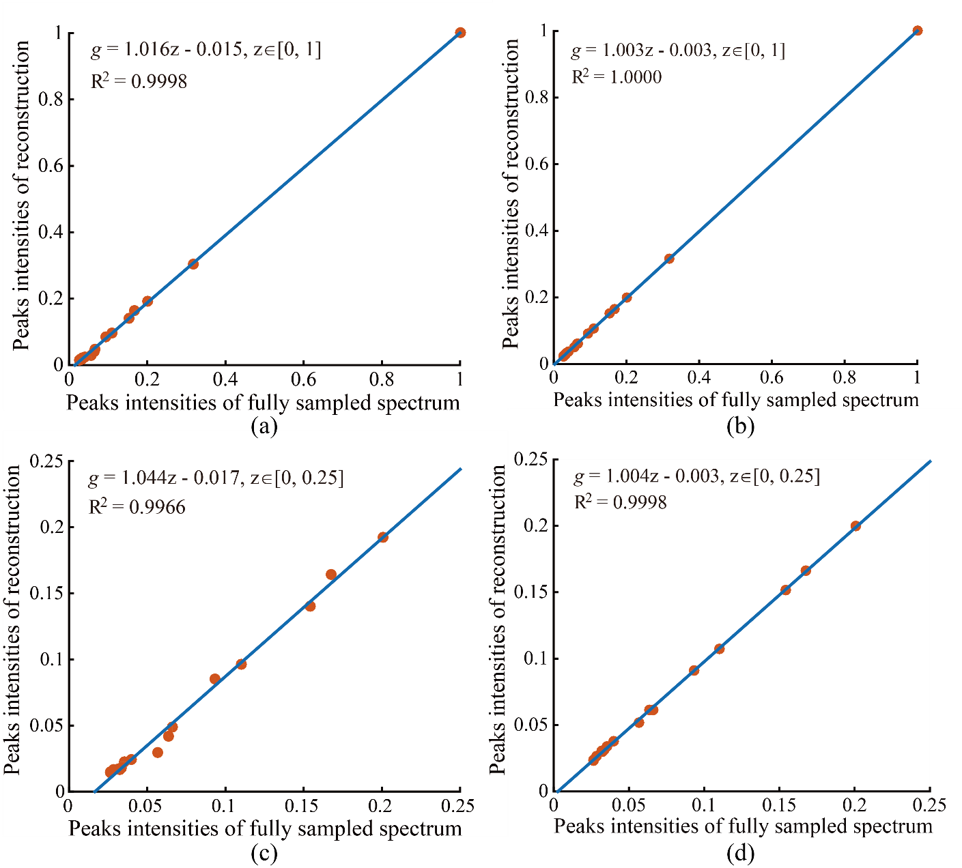
Fig.5 Peak intensities correlation between ground-truth spectrum and reconstructed spectrum on STEU COSY. (a) and (b) are peak intensities correlations with all peaks included for CS and the proposed methods, respectively; (c) and (d) are peak intensities correlations, of which only those peaks whose amplitudes at a range of [0, 0.25] are included, for CS and the proposed method, respectively. The formula g = az + b denotes the fitted curve (see blue line) according to peak intensities between ground-truth and reconstructed spectra with a polynomial. The notation R2 denotes Pearsons linear correlation coefficient of fitted curve. The closer that the value of R2 gets to 1, the stronger the correlation between ground-truth and reconstructed spectra is. Note: The intensities of all spectra are normalized to a range of zero to one through diving intensities by the maximum absolute amplitude. Only the maximum intensity of each peak is included in the analysis of correlation evaluation.
Code:
The demo code of LRBHM-HTF can be downloaded here.
Acknowledgments:
This work was supported in part by the National Natural Science Foundation of China (61571380, 61672335, 61601276, and U1632274), in part by the Natural Science Foundation of Fujian Province of China (2015J01346 and 2016J05205), in part by the Important Joint Research Project on Major Diseases of Xiamen City (3502Z20149032), in part by the National Key Research and Development Program of China (2017YFC0108703), and in part by the Fundamental Research Funds for the Central Universities (20720150109). The authors would like to thank Yanqin Lin for valuable discussion on spatiotemporally encoded ultrafast sequence, Lucio Frydman for sharing codes of compressed sensing spatiotemporally encoded magnetic resonance spectroscopy and Tien-Mo Shih for polishing writing and also the editors and reviewers for their constructive comments.
References:
[1] Y. Shrot and L. Frydman, “Compressed sensing and the reconstruction of ultrafast 2D NMR data: Principles and biomolecular applications,” J. Magn. Resonance, vol. 209, no. 2, pp. 352–358, 2011.
[2] X. Qu et al., “Accelerated NMR spectroscopy with low-rank reconstruction,” Angewandte Chemie Int. Edition, vol. 54, no. 3, pp. 852–854, 2015.
[3] L. Frydman et al., “The acquisition of multidimensional NMR spectra within a single scan,” Proc. Nat. Academy Sci., vol. 99, no. 25, pp. 15858– 15862, 2002.
[4] Y. Hua and T. K. Sarkar, “Matrix pencil method for estimating parameters of exponentially damped/undamped sinusoids in noise,” IEEE Trans. Acoust., Speech, Signal Process., vol. 38, no. 5, pp. 814–824, May 1990.
[5] J.-F. Cai et al., “A singular value thresholding algorithm for matrix completion,” SIAM J. Optim., vol. 20, no. 4, pp. 1956–1982, 2010.
[6] N. Srebro, “Learning with matrix factorizations,” Ph.D. dissertation, Dept. Elect. Eng. Computer Sci., Massachusetts Institute of Technology, Cambridge, MA, USA, 2004.
[7] Y. Hua and T. K. Sarkar, “Matrix pencil method for estimating parameters of exponentially damped/undamped sinusoids in noise,” IEEE Trans. Acoust., Speech, Signal Process., vol. 38, no. 5, pp. 814–824, May 1990.
[8] S. G. Hyberts et al., “Poisson-gap sampling and FM reconstruction for enhancing resolution and sensitivity of protein NMR data,” J. Amer. Chem. Soc., vol. 132, no. 7, pp. 2145–2147, 2010.
[9] J. Ying et al., “Hankel matrix nuclear norm regularized tensor completion for N -dimensional exponential signals,” IEEE Trans. Signal Process., vol. 65, no. 14, pp. 3702–3717, 2017.
[10] H. Lu et al., “A low rank hankel matrix reconstruction method for ultrafast magnetic resonance spectroscopy,” in Proc. 39th Annu. Int. Conf. IEEE Eng. Med. Biol. Soc., 2017, pp. 3267–3272.
[11] Y. Chen and Y. Chi, “Robust spectral compressed sensing via structured matrix completion,” IEEE Trans. Inf. Theory, vol. 60, no. 10, pp. 6576–6601, Oct. 2014.
[12] J. C. Hoch and A. S. Stern, NMR Data Processing. New York, NY, USA: Wiley-Liss, 1996.
[13] K. Kazimierczuk and V. Y. Orekhov, “Accelerated NMR spectroscopy by using compressed sensing,” Angewandte Chemie Int. Edition, vol. 50, no. 24, pp. 5556–5559, 2011.
[14] M. Betz et al., “Biomolecular NMR: A chaperone to drug discovery,” Current Opinion Chem. Biol., vol. 10, no. 3, pp. 219–225, 2006.
[15]
G. Topcu and A. Ulubelen, “Structure elucidation of organic compounds from natural sources using 1D and 2D NMR techniques,” J. Mol. Struct., vol. 834–836, pp. 57–73, 2007.
[16]
A.-H. M. Emwas et al., “NMR-based metabolomics in human disease diagnosis: Applications, limitations, and recommendations,” Metabolomics, vol. 9, no. 5, pp. 1048–1072, 2013.